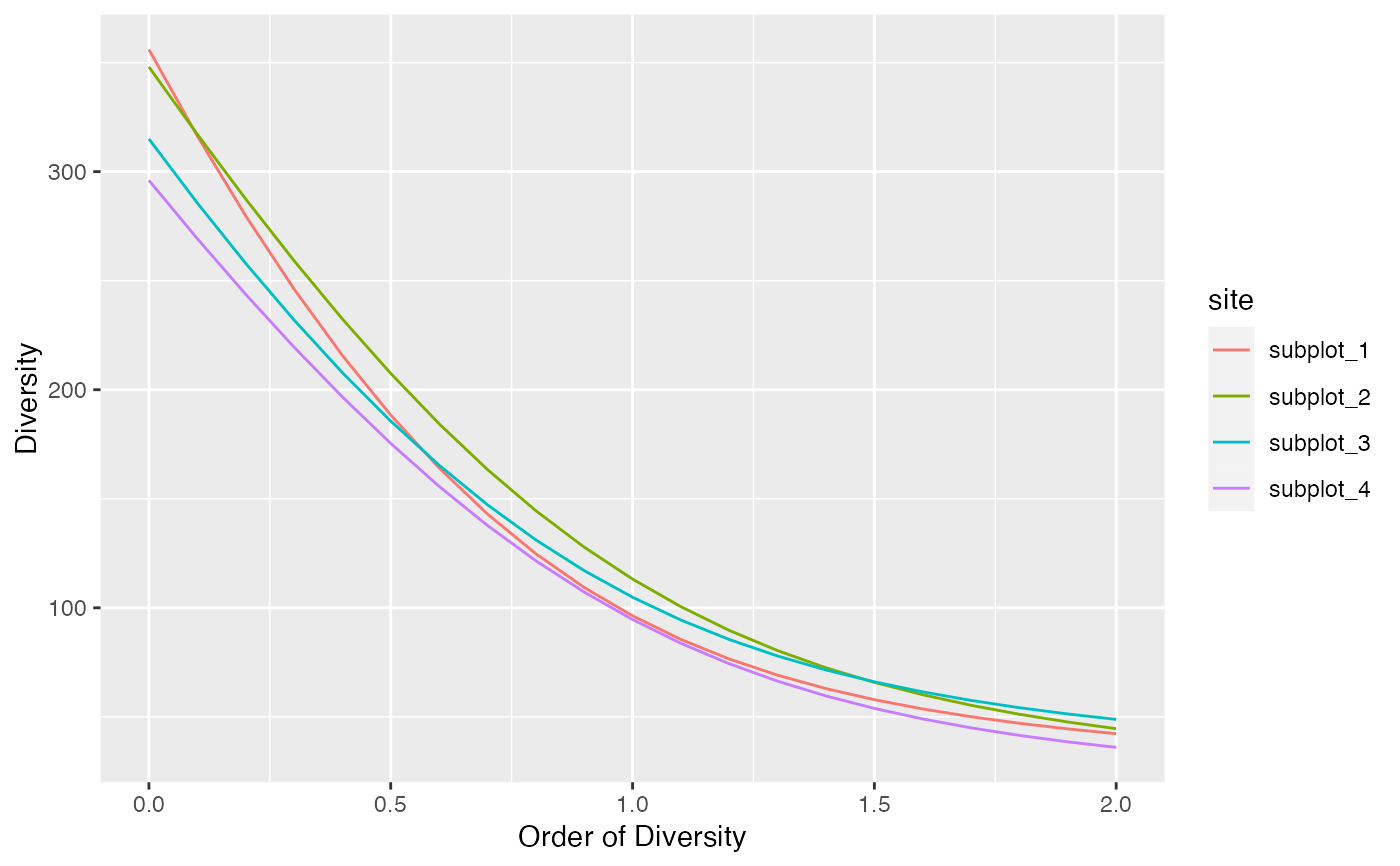
Calculate the diversity profile of a community, i.e. diversity (Hill numbers) against its order.
Usage
profile_hill(x, orders = seq(from = 0, to = 2, by = 0.1), ...)

# S3 method for class 'numeric'
profile_hill(
  x,
  orders = seq(from = 0, to = 2, by = 0.1),
  estimator = c("UnveilJ", "ChaoJost", "ChaoShen", "GenCov", "Grassberger", "Holste",
    "Marcon", "UnveilC", "UnveiliC", "ZhangGrabchak", "naive"),
  level = NULL,
  probability_estimator = c("Chao2015", "Chao2013", "ChaoShen", "naive"),
  unveiling = c("geometric", "uniform", "none"),
  richness_estimator = c("jackknife", "iChao1", "Chao1", "naive"),
  jack_alpha = 0.05,
  jack_max = 10,
  coverage_estimator = c("ZhangHuang", "Chao", "Turing", "Good"),
  q_threshold = 10,
  sample_coverage = NULL,
  as_numeric = FALSE,
  n_simulations = 0,
  alpha = 0.05,
  bootstrap = c("Chao2015", "Marcon2012", "Chao2013"),
  show_progress = TRUE,
  ...,
  check_arguments = TRUE
)

# S3 method for class 'species_distribution'
profile_hill(
  x,
  orders = seq(from = 0, to = 2, by = 0.1),
  estimator = c("UnveilJ", "ChaoJost", "ChaoShen", "GenCov", "Grassberger", "Holste",
    "Marcon", "UnveilC", "UnveiliC", "ZhangGrabchak", "naive"),
  level = NULL,
  probability_estimator = c("Chao2015", "Chao2013", "ChaoShen", "naive"),
  unveiling = c("geometric", "uniform", "none"),
  richness_estimator = c("jackknife", "iChao1", "Chao1", "naive"),
  jack_alpha = 0.05,
  jack_max = 10,
  coverage_estimator = c("ZhangHuang", "Chao", "Turing", "Good"),
  q_threshold = 10,
  gamma = FALSE,
  n_simulations = 0,
  alpha = 0.05,
  bootstrap = c("Chao2015", "Marcon2012", "Chao2013"),
  show_progress = TRUE,
  ...,
  check_arguments = TRUE
)
Arguments
- x
An object, that may be a numeric vector containing abundances or probabilities, or an object of class abundances or probabilities.
- orders
The orders of diversity used to build the profile.
- ...
Unused.
- estimator
An estimator of entropy.
- level
the level of interpolation or extrapolation. It may be a sample size (an integer) or a sample coverage (a number between 0 and 1). If not
NULL, the asymptoticestimatoris ignored.- probability_estimator
a string containing one of the possible estimators of the probability distribution (see probabilities). Used only for extrapolation.
- unveiling
a string containing one of the possible unveiling methods to estimate the probabilities of the unobserved species (see probabilities). Used only for extrapolation.
- richness_estimator
an estimator of richness to evaluate the total number of species, see div_richness. used for interpolation and extrapolation.
- jack_alpha
the risk level, 5% by default, used to optimize the jackknife order.
- jack_max
the highest jackknife order allowed. Default is 10.
- coverage_estimator
an estimator of sample coverage used by coverage.
- q_threshold
the value of
qabove which diversity is computed directly with the naive estimator \((\sum{p_s^q}^{\frac{1}{(1-q)}}\), without computing entropy. Whenqis great, the exponential of entropy goes to \(0^{\frac{1}{(1-q)}}\), causing rounding errors while the naive estimator of diversity is less and less biased.- sample_coverage
the sample coverage of
xcalculated elsewhere. Used to calculate the gamma diversity of meta-communities, see details.- as_numeric
if
TRUE, a number or a numeric vector is returned rather than a tibble.- n_simulations
The number of simulations used to estimate the confidence envelope of the profile.
- alpha
The risk level, 5% by default, of the confidence envelope of the profile.
- bootstrap
the method used to obtain the probabilities to generate bootstrapped communities from observed abundances. If "Marcon2012", the probabilities are simply the abundances divided by the total number of individuals (Marcon et al. 2012) . If "Chao2013" or "Chao2015" (by default), a more sophisticated approach is used (see as_probabilities) following Chao et al. (2013) or Chao and Jost (2015) .
- show_progress
if TRUE, a progress bar is shown during long computations.
- check_arguments
if
TRUE, the function arguments are verified. Should be set toFALSEto save time when the arguments have been checked elsewhere.- gamma
if
TRUE, \(\gamma\) diversity, i.e. diversity of the metacommunity, is computed.
Value
A tibble with the site names, the estimators used and the estimated diversity at each order. This is an object of class "profile" that can be plotted.
Details
A bootstrap confidence interval can be produced by simulating communities
(their number is n_simulations) with rcommunity and calculating their profiles.
Simulating communities implies a downward bias in the estimation:
rare species of the actual community may have abundance zero in simulated communities.
Simulated diversity values are recentered so that their mean is that of the actual community.
References
Chao A, Jost L (2015).
“Estimating Diversity and Entropy Profiles via Discovery Rates of New Species.”
Methods in Ecology and Evolution, 6(8), 873–882.
doi:10.1111/2041-210X.12349
.
Chao A, Wang Y, Jost L (2013).
“Entropy and the Species Accumulation Curve: A Novel Entropy Estimator via Discovery Rates of New Species.”
Methods in Ecology and Evolution, 4(11), 1091–1100.
doi:10.1111/2041-210x.12108
.
Marcon E, Hérault B, Baraloto C, Lang G (2012).
“The Decomposition of Shannon's Entropy and a Confidence Interval for Beta Diversity.”
Oikos, 121(4), 516–522.
doi:10.1111/j.1600-0706.2011.19267.x
.
Examples
autoplot(profile_hill(paracou_6_abd))