Phylogenetic Diversity of a Community
PhyloDiversity.RdCalculates the phylogenetic diversity of order \(q\) of a probability vector.
Usage
PhyloDiversity(NorP, q = 1, Tree, Normalize = TRUE, ...)
bcPhyloDiversity(Ns, q = 1, Tree, Normalize = TRUE, Correction = "Best",
  CheckArguments = TRUE)
# S3 method for class 'ProbaVector'
PhyloDiversity(NorP, q = 1, Tree, Normalize = TRUE,
  ..., CheckArguments = TRUE, Ps = NULL)
# S3 method for class 'AbdVector'
PhyloDiversity(NorP, q = 1, Tree, Normalize = TRUE,
  Correction = "Best", ..., CheckArguments = TRUE, Ns = NULL)
# S3 method for class 'integer'
PhyloDiversity(NorP, q = 1, Tree, Normalize = TRUE,
  Correction = "Best", ..., CheckArguments = TRUE, Ns = NULL)
# S3 method for class 'numeric'
PhyloDiversity(NorP, q = 1, Tree, Normalize = TRUE,
  Correction = "Best", ..., CheckArguments = TRUE, Ps = NULL, Ns = NULL)
is.PhyloDiversity(x)
# S3 method for class 'PhyloDiversity'
summary(object, ...)
Arguments
- Ps
A probability vector, summing to 1.
- Ns
A numeric vector containing species abundances.
- NorP
A numeric vector, an integer vector, an abundance vector (
AbdVector) or a probability vector (ProbaVector). Contains either abundances or probabilities.- q
A number: the order of diversity. Default is 1.
- Tree
An object of class
hclust, "phylo" (seeread.tree),phylogorPPtree. The tree must be ultrametric.- Normalize
If
TRUE(default), theTotaldiversity is not affected by the height of the tree.
IfFALSE, it is proportional to the height of the tree.- Correction
A string containing one of the possible corrections:
"None"(no correction),"ChaoShen","Grassberger","Holste","Bonachela"or"Best", the default value.- CheckArguments
Logical; if
TRUE, the function arguments are verified. Should be set toFALSEto save time when the arguments have been checked elsewhere.- x
An object to be tested or plotted
- object
A
PhyloDiversityobject to be summarized.- ...
Additional arguments to be passed to the generic methods.
Details
The phylogenetic entropy is its generalization of HCDT entropy to unequal species distances (Pavoine et al., 2009).
Diversity is obtained by transforming generalized entropy.
Bias correction requires the number of individuals to estimate sample Coverage. Use bcPhyloDiversity and choose the Correction.
The functions are designed to be used as simply as possible. PhyloDiversity is a generic method. If its first argument is an abundance vector, an integer vector or a numeric vector which does not sum to 1, the bias corrected function bcPhyloDiversity is called. Explicit calls to bcPhyloDiversity (with bias correction) or to PhyloDiversity.ProbaVector (without correction) are possible to avoid ambiguity. The .integer and .numeric methods accept Ps or Ns arguments instead of NorP for backward compatibility.
Note
The tree must contain all species of the probability vector. If it contains extra species, computation time will just be increased.
Value
An object of class PhyloDiversity is a list:
- Distribution
The distribution used to calculate diversity
- Function
The function used to calculate diversity
- Tree
The functional or phylogenetic tree used to calculate diversity
- Normalized
Logical. Indicates whether phylodiversity is normalized or proportional to the height of the tree.
- Type
The type of diversity ("alpha", "beta" or "gamma").
- Order
The order of diversity \(q\).
- Cuts
A named vector containing values of neutral diversity along the tree. Names are cut ends, i.e. the ends of intervals (the first interval starts at 0 for leaves, the max value is the height of the tree).
- Total
A value equal the total diversity (obtained by transforming the total normalized entropy), multiplied by the tree height if
Normalizeis FALSE.
is.PhyloDiversity returns TRUE if the object is of class PhyloDiversity.
summary.PhyloDiversity returns a summary of the object's value.
PhyloDiversity objects can be plotted by plot.PhyloValue because PhyloDiversity objects are also of class PhyloValue.
References
Chao, A., Chiu, C.-H. and Jost, L. (2010). Phylogenetic diversity measures based on Hill numbers. Philosophical Transactions of the Royal Society B 365(1558): 3599-609.
Marcon, E., Herault, B. (2015). Decomposing Phylodiversity. Methods in Ecology and Evolution 6(3): 333-339.
Pavoine, S., Love, M. S. and Bonsall, M. B. (2009). Hierarchical partitioning of evolutionary and ecological patterns in the organization of phylogenetically-structured species assemblages: Application to rockfish (genus: Sebastes) in the Southern California Bight. Ecology Letters 12(9): 898-908.
Examples
# Load Paracou data (number of trees per species in two 1-ha plot of a tropical forest
# and their taxonomy)
data(Paracou618)
# Ps is the vector of probabilities
Ps <- as.ProbaVector(Paracou618.MC$Ps)
# Calculate the phylogenetic Shannon diversity of the plot
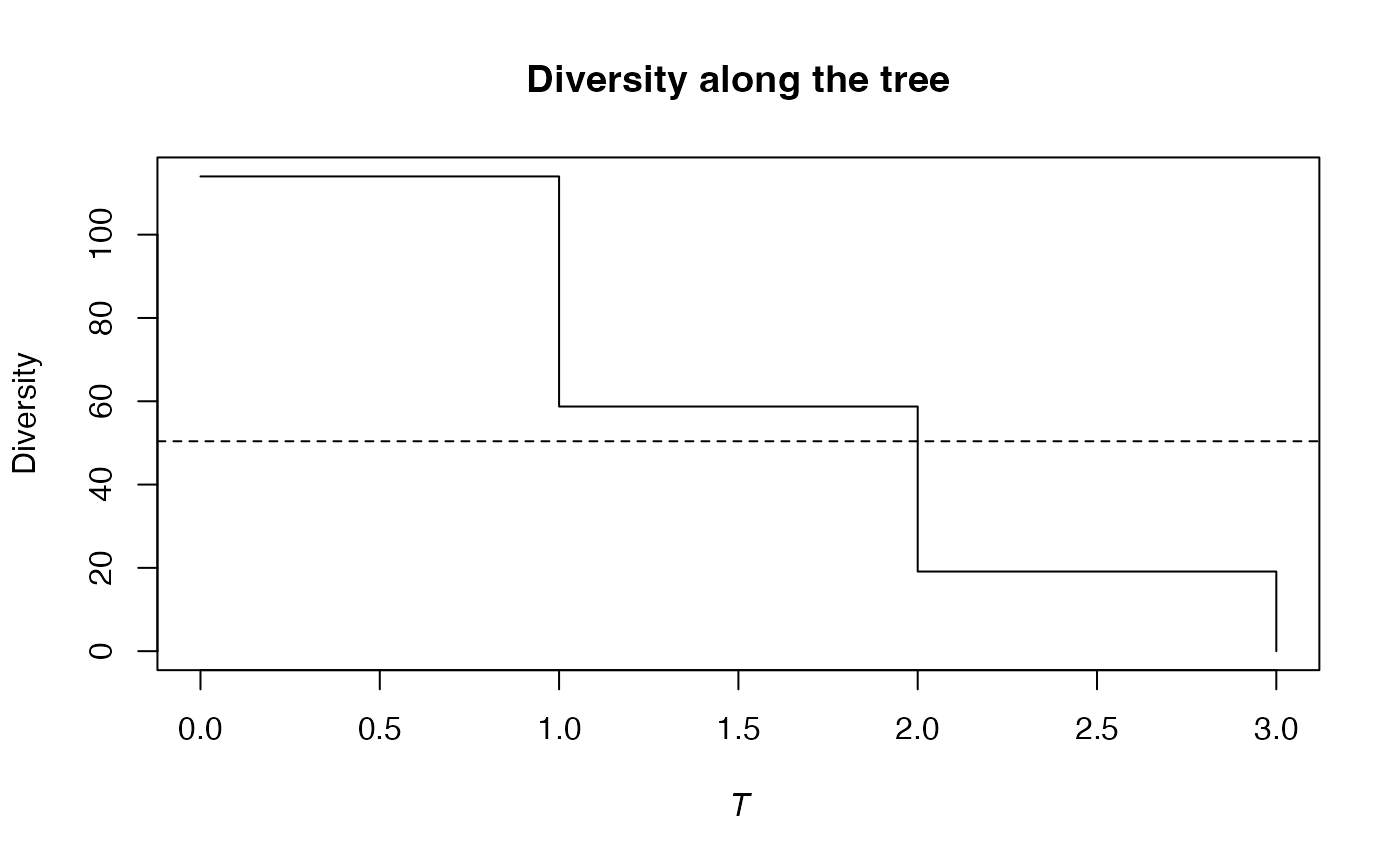
summary(PhyloDiversity(Ps, 1, Paracou618.Taxonomy) -> d)
#> alpha or gamma phylogenetic or functional diversity of order 1 of distribution
#> -
#> with correction: None
#> Phylogenetic or functional diversity was calculated according to the tree
#> Paracou618.Taxonomy
#>
#> Diversity is normalized
#>
#> Diversity equals: 50.39747
plot(d)
 # Ns is the vector of abundances of the metacommunity
Ns <- as.AbdVector(Paracou618.MC$Ns)
# Calculate the phylogenetic Shannon diversity of the plot
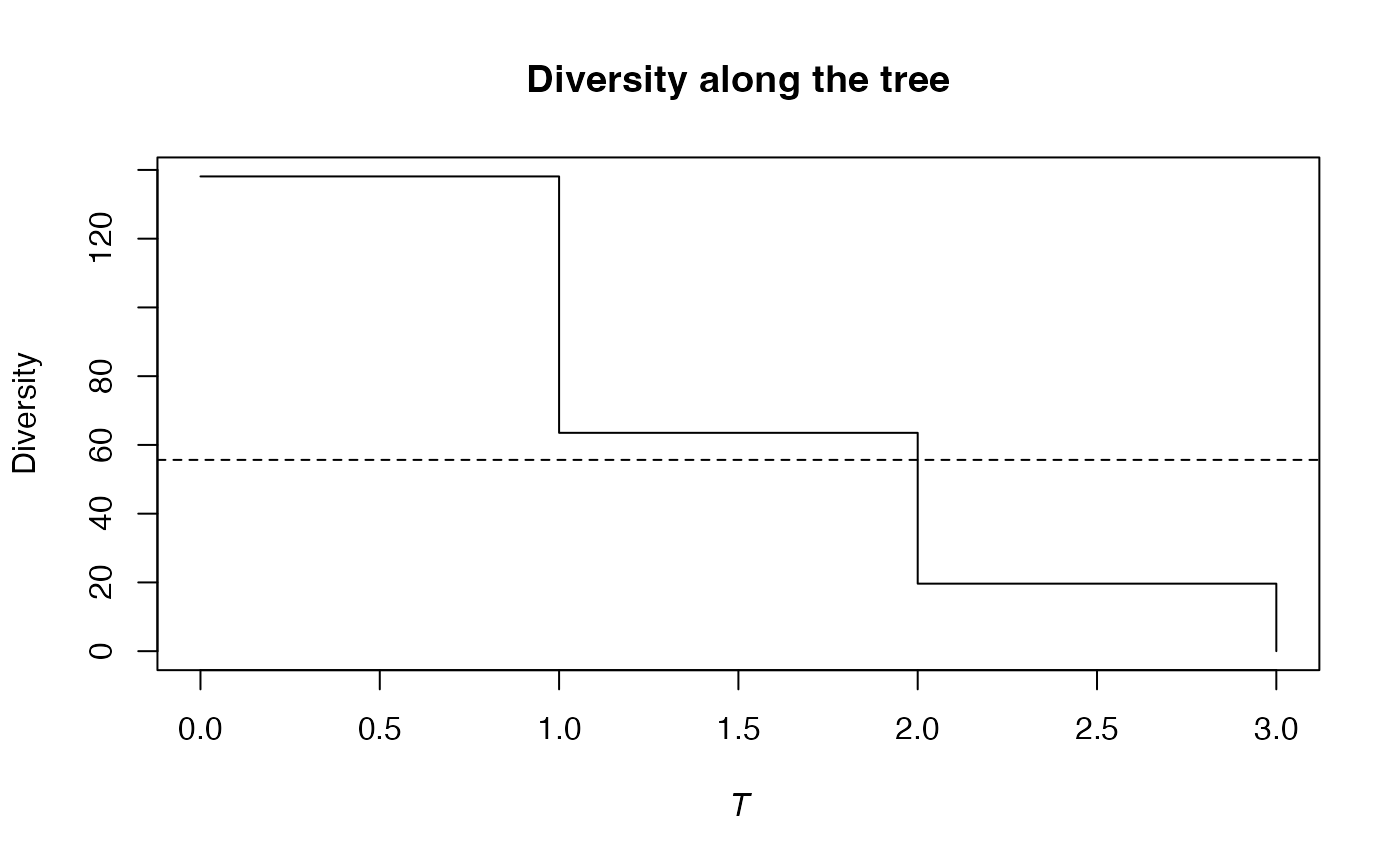
summary(bcPhyloDiversity(Ns, 1, Paracou618.Taxonomy, Correction = "Best") -> d)
#> alpha or gamma phylogenetic or functional diversity of order 1 of distribution
#> -
#> with correction: Best
#> Phylogenetic or functional diversity was calculated according to the tree
#> Paracou618.Taxonomy
#>
#> Diversity is normalized
#>
#> Diversity equals: 55.64502
plot(d)
# Ns is the vector of abundances of the metacommunity
Ns <- as.AbdVector(Paracou618.MC$Ns)
# Calculate the phylogenetic Shannon diversity of the plot
summary(bcPhyloDiversity(Ns, 1, Paracou618.Taxonomy, Correction = "Best") -> d)
#> alpha or gamma phylogenetic or functional diversity of order 1 of distribution
#> -
#> with correction: Best
#> Phylogenetic or functional diversity was calculated according to the tree
#> Paracou618.Taxonomy
#>
#> Diversity is normalized
#>
#> Diversity equals: 55.64502
plot(d)