Spatial Diversity and Entropy Accumulation Curves represent the accumulation of entropy and diversity with respect to the distance from individuals
Usage
accum_sp_tsallis(
  X,
  orders = 0,
  neighbors = 1:ceiling(X$n/2),
  r = NULL,
  correction = c("none", "extrapolation"),
  entropy_estimator = c("UnveilJ", "ChaoJost", "ChaoShen", "GenCov", "Grassberger",
    "Marcon", "UnveilC", "UnveiliC", "ZhangGrabchak", "naive", "Bonachela", "Holste"),
  richness_estimator = c("jackknife", "iChao1", "Chao1", "rarefy", "naive"),
  probability_estimator = c("Chao2015", "Chao2013", "ChaoShen", "naive"),
  unveiling = c("geometric", "uniform", "none"),
  jack_alpha = 0.05,
  jack_max = 10,
  coverage_estimator = c("ZhangHuang", "Chao", "Turing", "Good"),
  individual = FALSE,
  show_progress = TRUE,
  check_arguments = TRUE
)

accum_sp_hill(
  X,
  orders = 0,
  neighbors = 1:ceiling(X$n/2),
  r = NULL,
  correction = c("none", "extrapolation"),
  entropy_estimator = c("UnveilJ", "ChaoJost", "ChaoShen", "GenCov", "Grassberger",
    "Marcon", "UnveilC", "UnveiliC", "ZhangGrabchak", "naive", "Bonachela", "Holste"),
  richness_estimator = c("jackknife", "iChao1", "Chao1", "rarefy", "naive"),
  probability_estimator = c("Chao2015", "Chao2013", "ChaoShen", "naive"),
  unveiling = c("geometric", "uniform", "none"),
  jack_alpha = 0.05,
  jack_max = 10,
  coverage_estimator = c("ZhangHuang", "Chao", "Turing", "Good"),
  h0 = c("none", "multinomial", "random location", "binomial"),
  alpha = 0.05,
  n_simulations = 100,
  individual = FALSE,
  show_progress = TRUE,
  check_arguments = TRUE
)

accum_mixing(
  X,
  orders = 0,
  neighbors = 1:ceiling(X$n/2),
  r = NULL,
  correction = c("none", "extrapolation"),
  entropy_estimator = c("UnveilJ", "ChaoJost", "ChaoShen", "GenCov", "Grassberger",
    "Marcon", "UnveilC", "UnveiliC", "ZhangGrabchak", "naive", "Bonachela", "Holste"),
  richness_estimator = c("jackknife", "iChao1", "Chao1", "rarefy", "naive"),
  probability_estimator = c("Chao2015", "Chao2013", "ChaoShen", "naive"),
  unveiling = c("geometric", "uniform", "none"),
  jack_alpha = 0.05,
  jack_max = 10,
  coverage_estimator = c("ZhangHuang", "Chao", "Turing", "Good"),
  h0 = c("none", "multinomial", "random location", "binomial"),
  alpha = 0.05,
  n_simulations = 100,
  individual = FALSE,
  show_progress = TRUE,
  check_arguments = TRUE
)
Arguments
- X
a spatialized community (A dbmss::wmppp object with
PointTypevalues as species names.)- orders
a numeric vector: the diversity orders to address. Default is 0.
- neighbors
a vector of integers. Entropy will be accumulated along this number of neighbors around each individual. Default is 10% of the individuals.
- r
a vector of distances. If
NULLaccumulation is alongn, else neighbors are accumulated in circles of radiusr.- correction
The edge-effect correction to apply when estimating the entropy of a neighborhood community that does not fit in the window. Does not apply if neighborhoods are defined by the number of neighbors. Default is "none". "extrapolation" extrapolates the observed diversity up to the number of individuals estimated in the full area of the neighborhood, which is slow.
- entropy_estimator
The asymptotic estimator of entropy when
correctionis "extrapolation".- richness_estimator
an estimator of richness to evaluate the total number of species, see div_richness. used for interpolation and extrapolation.
- probability_estimator
a string containing one of the possible estimators of the probability distribution (see probabilities). Used only for extrapolation.
- unveiling
a string containing one of the possible unveiling methods to estimate the probabilities of the unobserved species (see probabilities). Used only for extrapolation.
- jack_alpha
the risk level, 5% by default, used to optimize the jackknife order.
- jack_max
the highest jackknife order allowed. Default is 10.
- coverage_estimator
an estimator of sample coverage used by coverage.
- individual
If
TRUE, individual neighborhood entropies are returned.- show_progress
if TRUE, a progress bar is shown during long computations.
- check_arguments
if
TRUE, the function arguments are verified. Should be set toFALSEto save time when the arguments have been checked elsewhere.- h0
The null hypothesis to compare the distribution of
Xto. If "none", the default value, no null hypothesis is tested. "multinomial" means the community will be rarefied down to the number ofneighbors. "random location" means the points will we randomly permuted across their actual locations. "binomial" means the points will we uniformly and independently drawn in the window (a binomial point process is a Poisson point process conditionally to the number of points).- alpha
the risk level, 5% by default.
- n_simulations
the number of simulations used to estimate the confidence envelope.
Value
an accum_sp object, that is also either an accum_sp_diversity, accum_sp_entropy or accum_sp_mixing object.
Details
accum_sp_hill() or accum_sp_tsallis() estimate the diversity or entropy
accumulation curve of a distribution.
Argument entropy_estimator is used to estimate asymptotic entropy or diversity
when argument correction is "extrapolation".
Then, richness_estimator is used if needed to estimate entropy.
If the jackknife is chosen, jack_alpha sets the uncertainty level that decides
increasing the jackknife estimator order, and jack_max is the highest
order allowed.
If entropy_estimator is an unveiled one, then probability_estimator and
unveiling define the method.
coverage_estimator sets the estimator of sample coverage.
In general, the default values of these arguments are a good choice.
Examples
# Generate a random community
X <- rspcommunity(1, size = 50, species_number = 3)
# Calculate the accumulation of richness
accum_n <- accum_sp_hill(X)
plot(accum_n, q = 0)
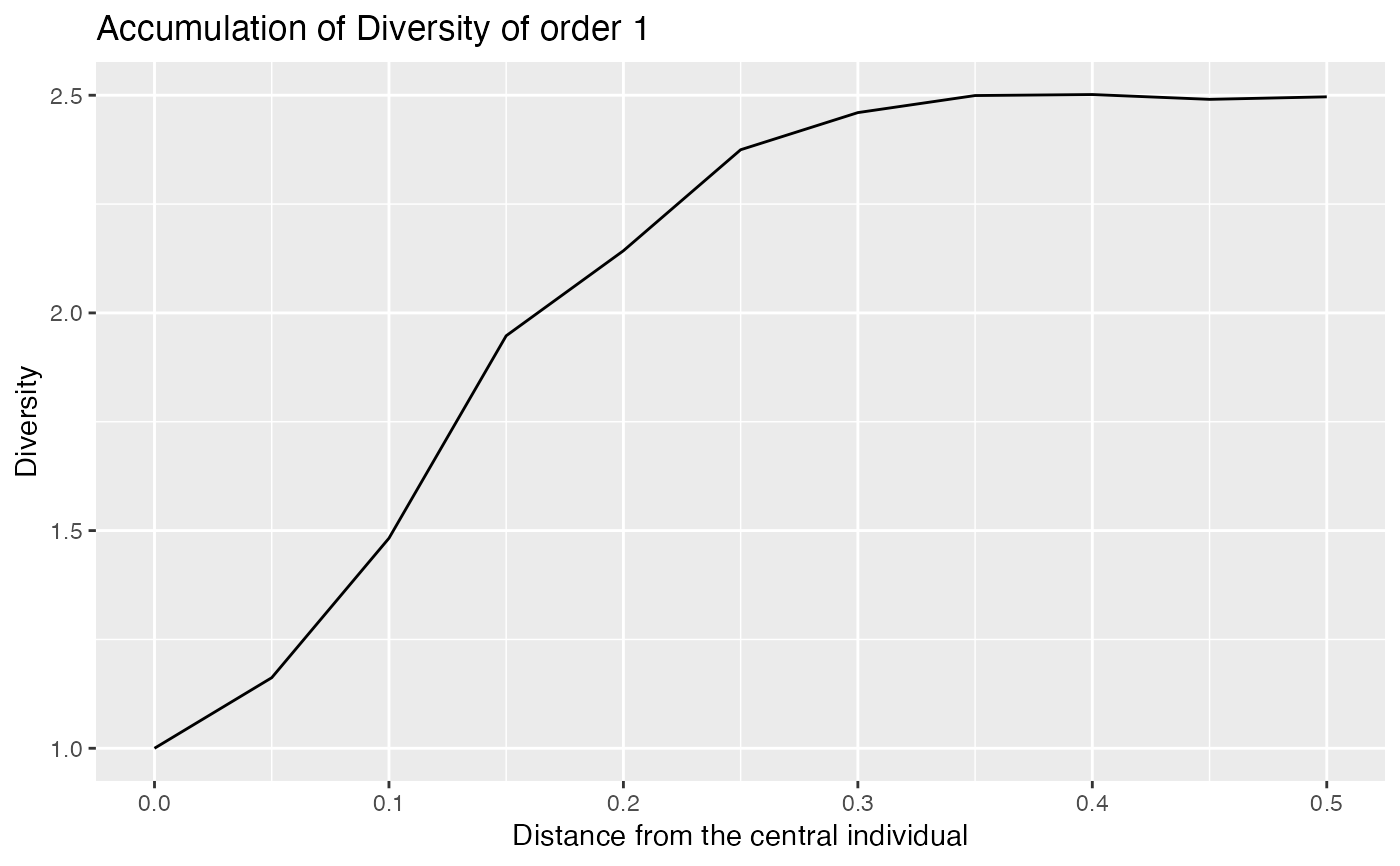
 # along distance
accum_r <- accum_sp_hill(X, orders = 1, r = seq(0, .5, .05))
autoplot(accum_r, q = 1)
# along distance
accum_r <- accum_sp_hill(X, orders = 1, r = seq(0, .5, .05))
autoplot(accum_r, q = 1)