Plot Diversity Accumulation
Arguments
- object
An "Accumulation" object that cat be accumulation of diversity (DivAccum), entropy (EntAccum) or the Mixing index (Mixing).
- ...
Further plotting arguments.
- q
The order of Diversity. By default, the first value found in the "Accumulation" object is used.
- main
Main title of the plot.
- xlab
X-axis label.
- ylab
Y-axis label.
- ylim
Limits of the Y-axis, as a vector of two numeric values.
- lineH0
if
TRUE, the values of the null hypothesis are plotted.- ShadeColor
The color of the shaded confidence envelope.
- BorderColor
The color of the borders of the confidence envelope.
Examples
# Generate a random community
spCommunity <- rSpCommunity(1, size=50, S=3)
# Calculate mixing indices of order 0 and 1
accum <- Mixing(spCommunity, q.seq=c(0,1))
#>
#>
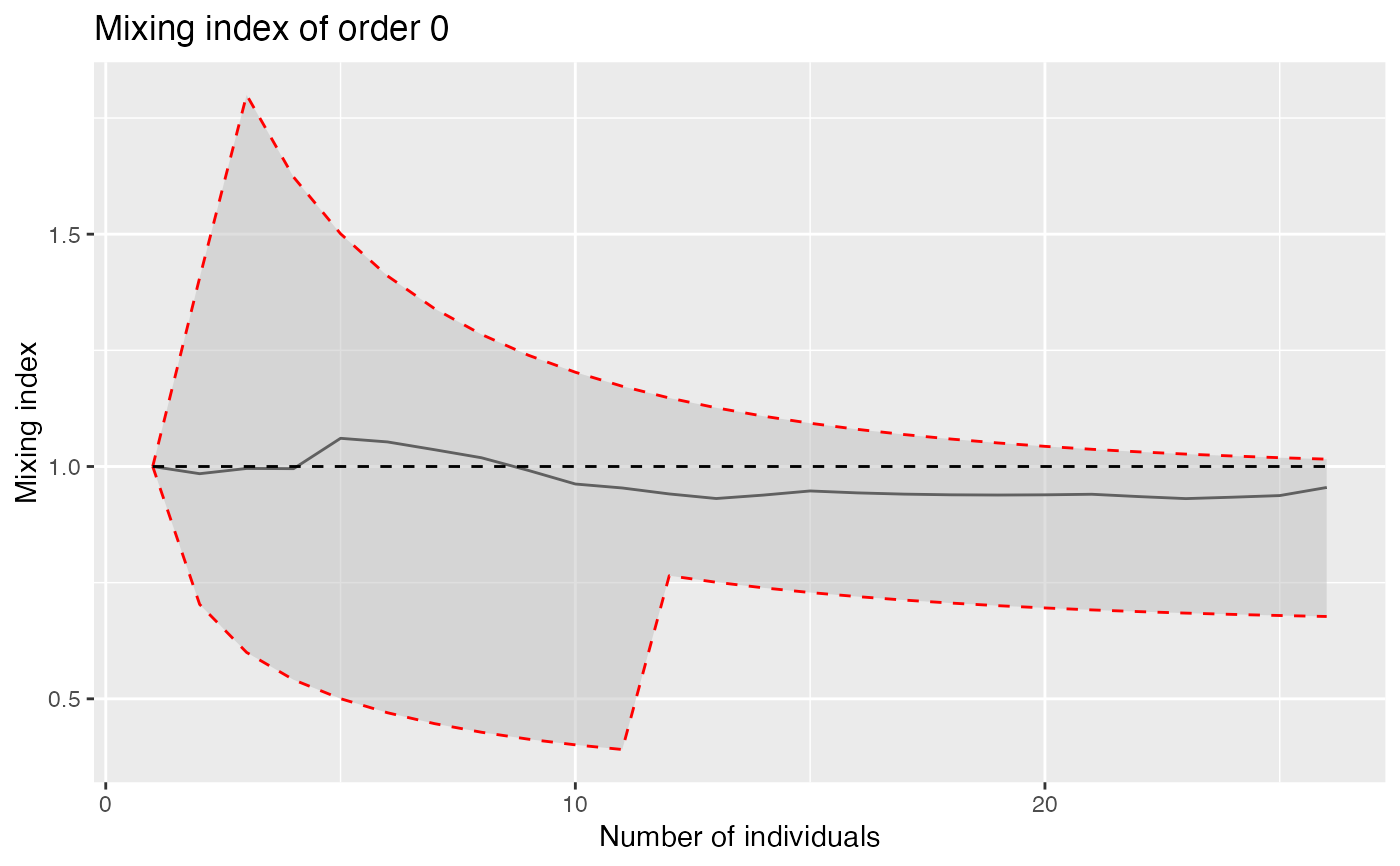
autoplot(accum, q=0)
