SpatDiv allows drawing random, spatialized communities as a whole, or species by species for more control.
Drawing random communities
The function rSpCommunity() draws a community (which is a weighted, marked, planar point pattern, i.e. a wmppp object defined in package dbmss) or a list of communities (an SpCommunities object) if argument n, the number of communities, is greater than 1.
library("SpatDiv")
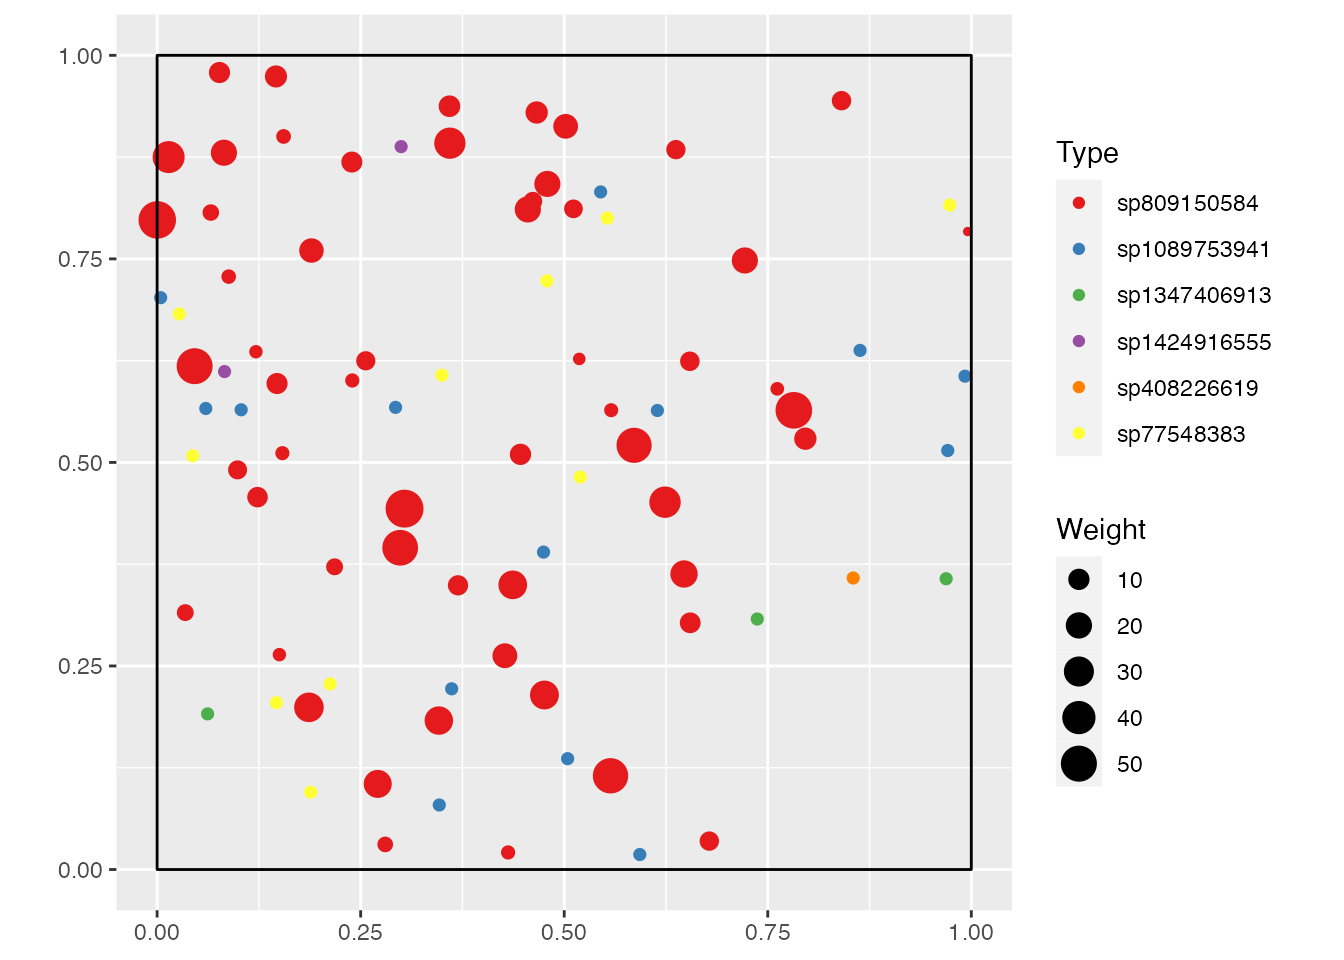
spCommunity <- rSpCommunity(1, size = 30, S = 5)
autoplot(spCommunity)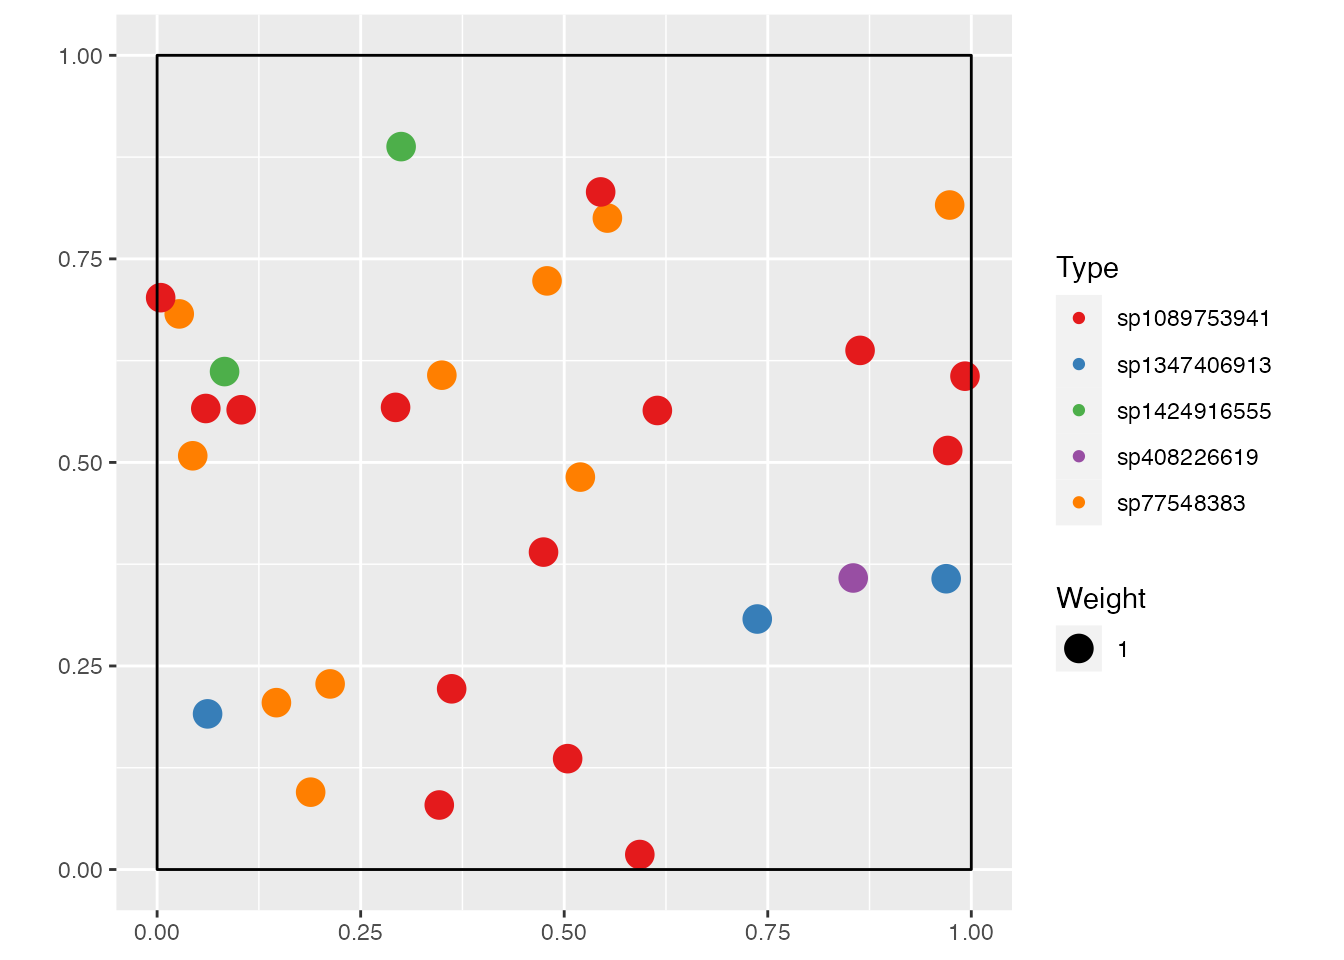
The random community obtained is made of 30 individuals in 5 species. All arguments are set by default:
- The species distribution of abundances is lognormal. It can be modified by the argument
Distribution. - The spatial window (argument
win) is a square of side 1. - The spatial distribution (argument
Spatial) of each species is multinomial (i.e. point locations are independent, but their number is fixed). - The species point patterns are independent.
- The size of all individuals (argument
Sizes) is 1.
Species abundances
Several species abundance distributions (SAD) are available:
-
Distribution = "lnorm": log-normal distribution with parametersd, the standard deviation of the logarithm of probabilities. The mean is forced bysize, the number of individuals. -
Distribution = "lseries": log-series distribution with parameteralpha. -
Distribution = "geom": geometric distribution with parameterprob. -
Distribution = "bstick": broken stick distribution.
Individual size
The distribution of sizes is chosen by the argument Sizes:
-
Sizes = "Uniform": a uniform distribution betweenMinSizeandMaxSize. By default,MinSizeandMaxSizeequal 1 so all sizes are set to 1. -
Sizes = "Exponential": a negative exponential distribution of rate \(-1/MeanSize\). -
Sizes = "Weibull": a Weibull distribution with parametersshapeandscale.MinSizeis added (i.e., it is the location parameter of the Weibull distribution with three parameters).
Drawing species separately
The function rSpSpecies() draws a single species spatial pattern, which is a a wmppp object.
spSpecies <- rSpSpecies(50, Spatial = "Thomas", Sizes = "Exponential")
autoplot(spSpecies)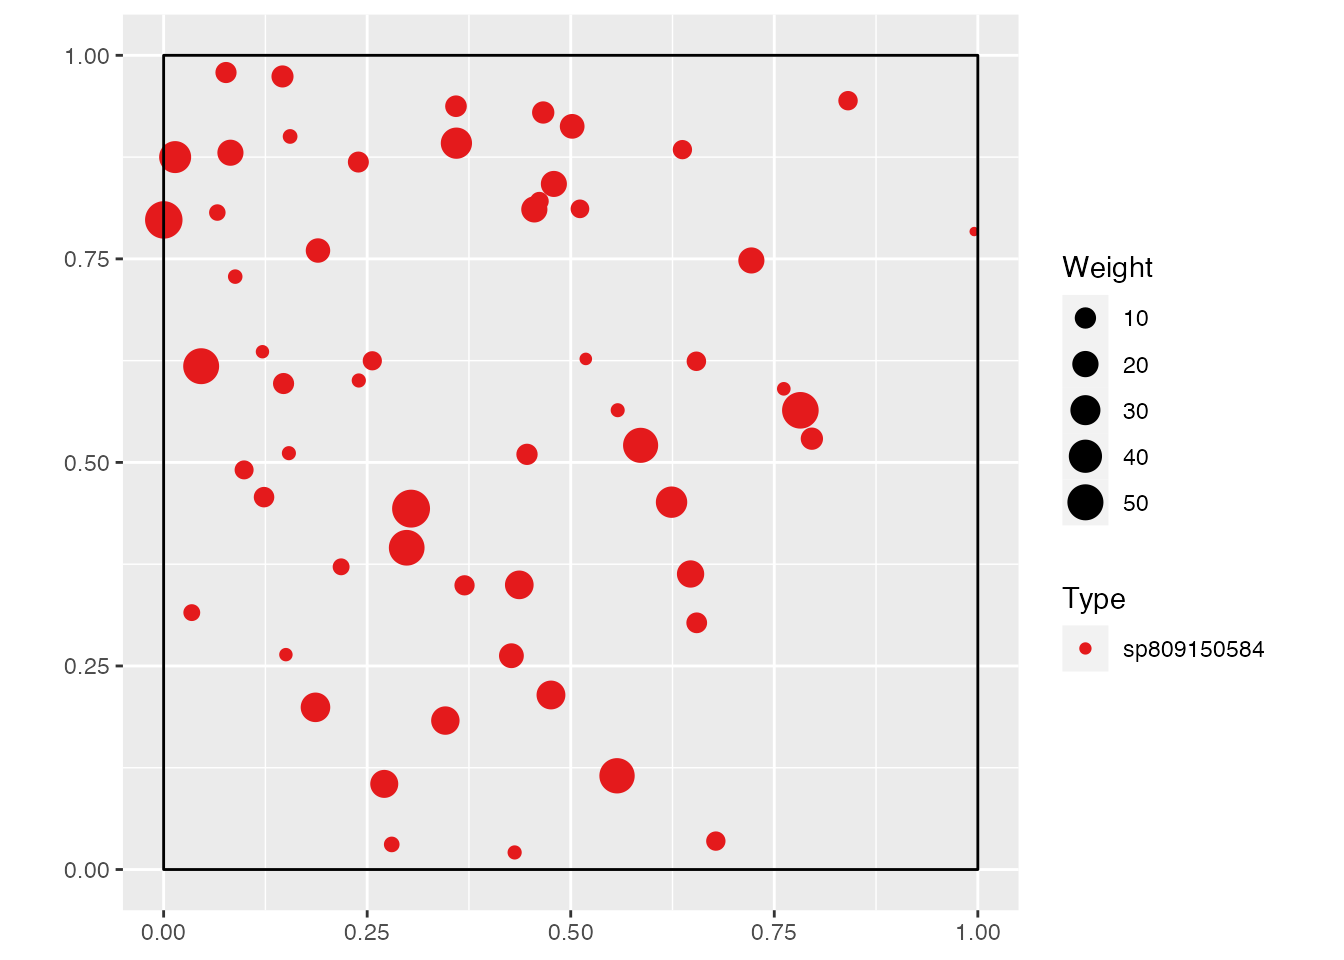
The point pattern of a a species is aggregated. It follows a Thomas point process with default arguments.
Available point processes are:
-
Binomial: points are draw independently like in a homogenous Poisson process but their number is forced ton. -
Thomas: points are clustered around centers whose density iskappa.muis the average number of points in each cluster.scaleis the standard deviation of the random displacement of points from the cluster centers.
More complex spatial distributions can be simulated in package spatstat. Spatial can be an object of class ppp (a planar point pattern) obtained that way.
Combining point patterns
Spatial communities stored in wmppp and SpCommunities objects can be superimposed by the superimpose() function from package dbmss.
library("dbmss")
superimpose(spSpecies, spCommunity) %>%
    autoplot()