Map Spatialized Communities
MapPlot(x, ...)

# S3 method for Accumulation
MapPlot(
  x,
  Order,
  NeighborHood,
  AllowJitter = TRUE,
  Nbx = 128,
  Nby = 128,
  Contour = TRUE,
  Palette = grDevices::topo.colors(128, alpha = 1),
  Contournlevels = 10,
  Contourcol = "dark red",
  Points = FALSE,
  pch = 20,
  Pointcol = "black",
  ...,
  CheckArguments = TRUE
)

# S3 method for fv
MapPlot(
  x,
  spCommunity,
  ReferenceType = "",
  r = median(x$r),
  AllowJitter = TRUE,
  Nbx = 128,
  Nby = 128,
  Contour = TRUE,
  Palette = grDevices::topo.colors(128, alpha = 1),
  Contournlevels = 10,
  Contourcol = "dark red",
  Points = FALSE,
  pch = 20,
  Pointcol = "black",
  ...,
  CheckArguments = TRUE
)
Arguments
- x
An object to map.
- ...
Further parameters.
- Order
The order of diversity, i.e. the value of $q$.
- NeighborHood
The neighborhood size, i.e. the number of neighbors or the distance to consider.
- AllowJitter
If
TRUE, duplicated points are jittered to avoid their elimination by the kriging procedure.- Nbx
The number of columns (pixels) of the resulting map, 128 by default.
- Nby
The number of rows (pixels) of the resulting map, 128 by default.
- Contour
If
TRUE, contours are added to the map.- Palette
The color palette of the map.
- Contournlevels
The number of levels of contours.
- Contourcol
The color of the contour lines.
- Points
If
TRUE, the points that brought the data are added to the map.- pch
The symbol used to represent points.
- Pointcol
The color of the points.
- CheckArguments
If
TRUE(default), the function arguments are verified. Should be set toFALSEto save time in simulations for example, when the arguments have been checked elsewhere.- spCommunity
A spatialized community (A wmppp.object with
PointTypevalues as species names.)- ReferenceType
The point type used to calculate the function values. The default value is "", i.e. all point types, but it will generate an error if the actual reference type is different.
- r
The distance at which the function value must be considered. The default value is the median distance used to calculate the function values.
Value
An autoKrige object that can be used to produce alternative maps.
Details
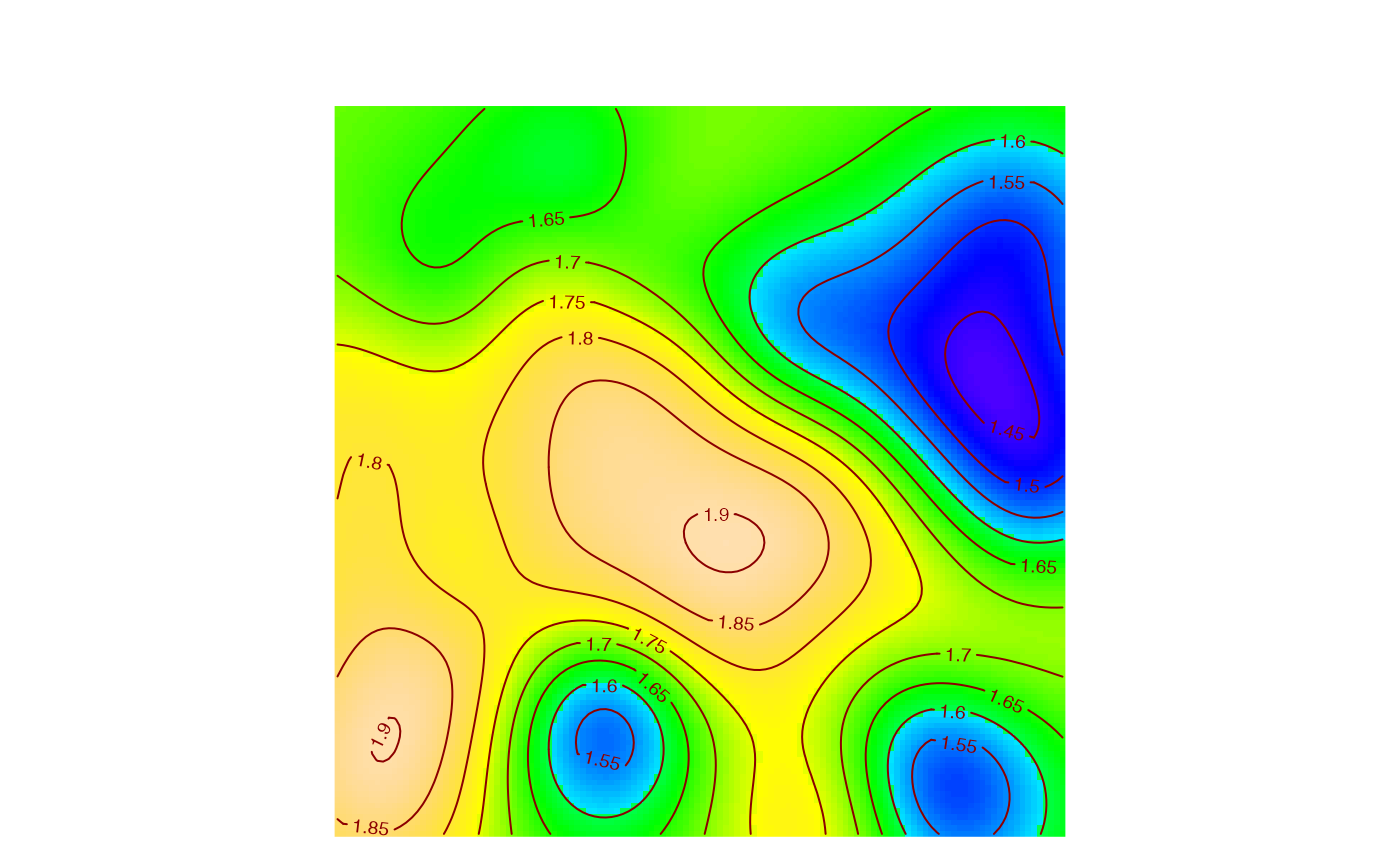
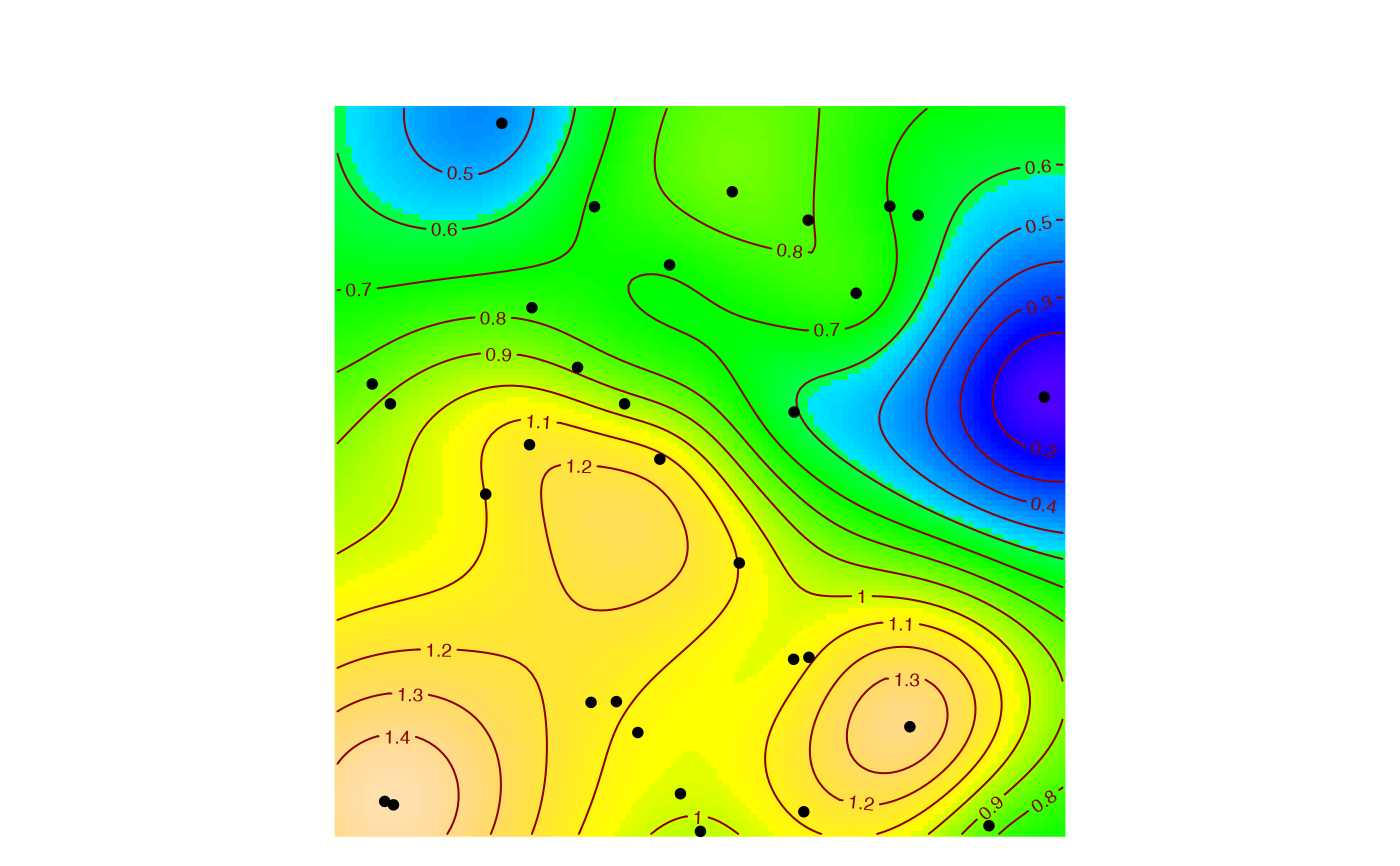
Maps of interpolated values from points of a spatialized community (a wmppp.object) are produced.
x may be:
an "Accum" object produced e.g. by the function DivAccum. A map of diversity of the chosen order within the chosen neighborhoods of points is obtained by kriging.
an fv object produced by a distance-based measure of spatial structure, such as dbmss:Mhat, with individual values. Then a map of the local value of the function is produced, following (Getis and Franklin 1987) .
Examples
# Generate a random community
spCommunity <- rSpCommunity(1, size=50, S=10)
# Calculate the species accumulation curve
accum <- DivAccum(spCommunity, q.seq=c(0,1), n.seq=4, Individual=TRUE)
# Plot the local richness, accumulated up to 5 individuals.
MapPlot(accum, Order=0, NeighborHood=5)
#> [using ordinary kriging]


# Generate a random community
spCommunity <- rSpCommunity(1, size=50, S=3, Species = paste0("sp",1:3))
library("dbmss")
#> Loading required package: spatstat.explore
#> Loading required package: spatstat.data
#> Loading required package: spatstat.geom
#> spatstat.geom 3.2-1
#> Loading required package: spatstat.random
#> spatstat.random 3.1-5
#> Loading required package: nlme
#> spatstat.explore 3.2-1
M_i <- Mhat(spCommunity, ReferenceType = "sp1", Individual = TRUE)
MapPlot(M_i, spCommunity, ReferenceType = "sp1", r=0.2, Points=TRUE)
#> [using ordinary kriging]
