A Species Distribution is a tibble::tibble containing species abundances or probabilities. Rows of the tibble are communities and column are species. Values are either abundances or probabilities. Special columns contain the site names, and their weights (e.g. their area or number of individuals): their names must be "site" and "weight". All other column names are considered as species names.
Usage
species_distribution(x, names = NULL, weights = NULL, check_arguments = TRUE)

as_species_distribution(x, ...)

# S3 method for class 'numeric'
as_species_distribution(x, ..., check_arguments = TRUE)

# S3 method for class 'matrix'
as_species_distribution(
  x,
  names = NULL,
  weights = NULL,
  ...,
  check_arguments = TRUE
)

# S3 method for class 'data.frame'
as_species_distribution(x, ..., check_arguments = TRUE)

# S3 method for class 'wmppp'
as_species_distribution(x, ..., check_arguments = TRUE)

# S3 method for class 'character'
as_species_distribution(x, ..., check_arguments = TRUE)

# S3 method for class 'factor'
as_species_distribution(x, ..., check_arguments = TRUE)

is_species_distribution(x)

as_probabilities(x, ...)

# S3 method for class 'numeric'
as_probabilities(x, ..., check_arguments = TRUE)

# S3 method for class 'matrix'
as_probabilities(x, names = NULL, weights = NULL, ..., check_arguments = TRUE)

# S3 method for class 'data.frame'
as_probabilities(x, ..., check_arguments = TRUE)

# S3 method for class 'wmppp'
as_probabilities(x, ..., check_arguments = TRUE)

# S3 method for class 'character'
as_probabilities(x, ..., check_arguments = TRUE)

# S3 method for class 'factor'
as_probabilities(x, ..., check_arguments = TRUE)

is_probabilities(x)

abundances(
  x,
  round = TRUE,
  names = NULL,
  weights = NULL,
  check_arguments = TRUE
)

as_abundances(x, ...)

# S3 method for class 'numeric'
as_abundances(x, round = TRUE, ..., check_arguments = TRUE)

# S3 method for class 'matrix'
as_abundances(
  x,
  round = TRUE,
  names = NULL,
  weights = NULL,
  ...,
  check_arguments = TRUE
)

# S3 method for class 'data.frame'
as_abundances(x, ..., check_arguments = TRUE)

# S3 method for class 'wmppp'
as_abundances(x, ..., check_arguments = TRUE)

# S3 method for class 'character'
as_abundances(x, ..., check_arguments = TRUE)

# S3 method for class 'factor'
as_abundances(x, ..., check_arguments = TRUE)

is_abundances(x)

# S3 method for class 'species_distribution'
as.matrix(x, use.names = TRUE, ...)

# S3 method for class 'species_distribution'
as.double(x, use.names = TRUE, ...)

# S3 method for class 'species_distribution'
as.numeric(x, use.names = TRUE, ...)
Arguments
- x
an object.
- names
The names of the species distributions.
- weights
the weights of the sites of the species distributions.
- check_arguments
if
TRUE, the function arguments are verified. Should be set toFALSEto save time when the arguments have been checked elsewhere.- ...
Unused.
- round
If
TRUE, the values ofxare rounded to the nearest integer.- use.names
If
TRUE, the names of thespecies_distributionare kept in the matrix or vector they are converted to.
Value
An object of classes species_distribution and abundances
or probabilities.
as.double() and its synonymous as.numeric() return a numeric vector
that contains species abundances or probabilities of a single-row
species_distribution.
as.matrix() returns a numeric matrix if the species_distribution contains
several rows.
These are methods of the generic functions for class species_distribution.
Details
species_distribution objects include abundances and probabilities
objects.
species_distribution() creates a species_distribution object from a vector
or a matrix or a dataframe.
as_species_distribution(), as_abundances() and as_probabilities format
the numeric, matrix or dataframe x so that appropriate
versions of community functions (generic methods such as plot or
div_richness) are applied.
Abundance values are rounded (by default) to the nearest integer.
They also accept a dbmss::wmppp objects,
i.e. a weighted, marked planar point pattern and count the abundances of
point types, character and factor objects.
as_probabilities() normalizes the vector x so that it sums to 1. It gives
the same output as probabilities() with estimator = "naive".
species_distribution objects objects can be plotted by plot and autoplot.
Examples
# Paracou data is a tibble
paracou_6_abd
#> # A tibble: 4 × 337
#> site weight Abarema_jupunba Abarema_mataybifolia Amaioua_guianensis
#> <chr> <dbl> <int> <int> <int>
#> 1 subplot_1 1.56 2 2 1
#> 2 subplot_2 1.56 2 0 1
#> 3 subplot_3 1.56 2 2 0
#> 4 subplot_4 1.56 4 0 0
#> # ℹ 332 more variables: Amanoa_congesta <int>, Amanoa_guianensis <int>,
#> # Ambelania_acida <int>, Amphirrhox_longifolia <int>, Andira_coriacea <int>,
#> # Apeiba_glabra <int>, Aspidosperma_album <int>, Aspidosperma_cruentum <int>,
#> # Aspidosperma_excelsum <int>, Bocoa_prouacensis <int>,
#> # Brosimum_guianense <int>, Brosimum_rubescens <int>, Brosimum_utile <int>,
#> # Carapa_surinamensis <int>, Caryocar_glabrum <int>, Casearia_decandra <int>,
#> # Casearia_javitensis <int>, Catostemma_fragrans <int>, …
# Class
class(paracou_6_abd)
#> [1] "abundances" "species_distribution" "tbl_df"
#> [4] "tbl" "data.frame"
is_species_distribution(paracou_6_abd)
#> [1] TRUE
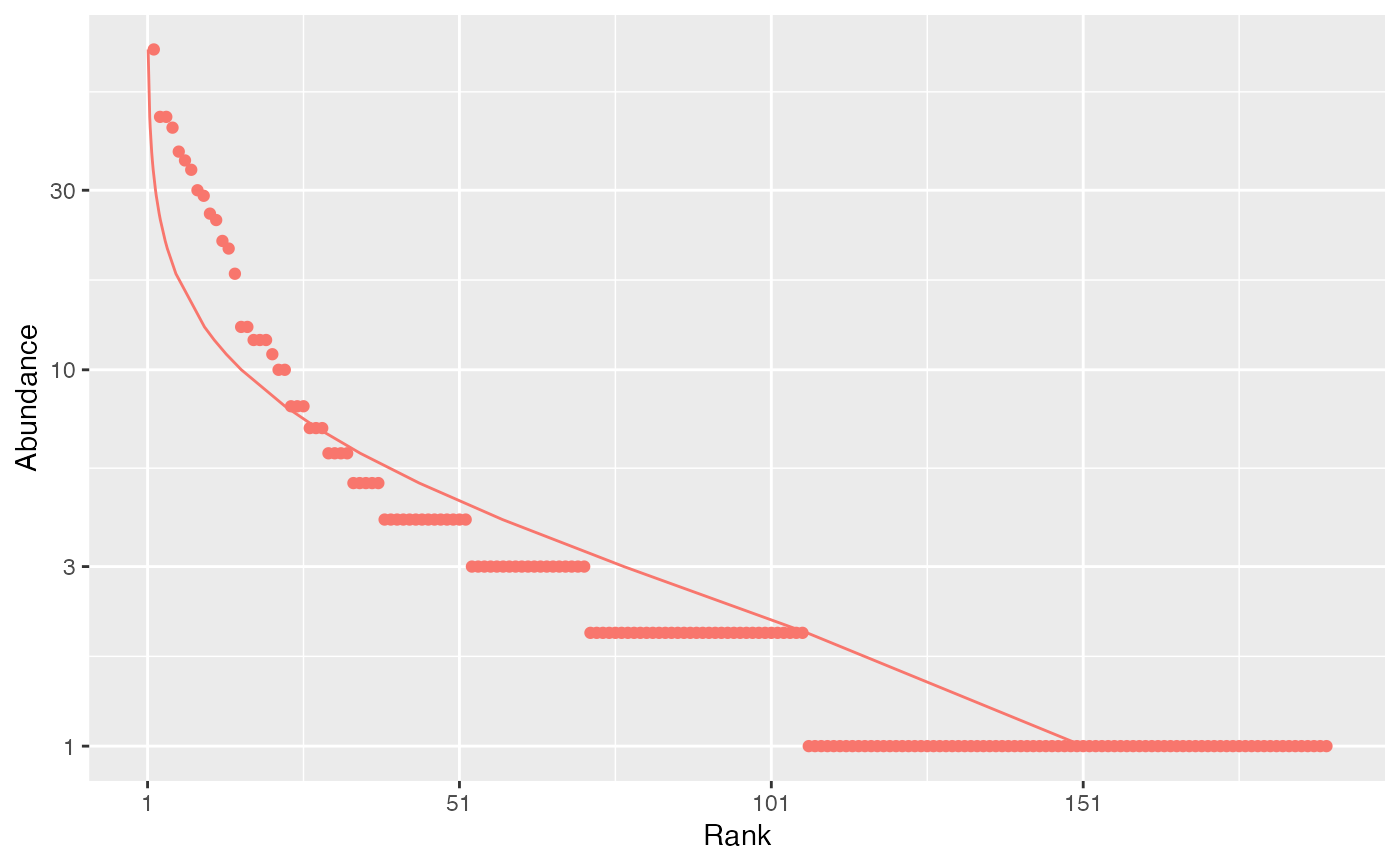
# Whittaker plot fitted by a log-normal distribution
autoplot(paracou_6_abd[1,], fit_rac = TRUE, distribution = "lnorm")
 # Character vectors
as_abundances(c("A", "C", "B", "C"))
#> # A tibble: 1 × 5
#> site weight A B C
#> <chr> <dbl> <dbl> <dbl> <dbl>
#> 1 site_1 4 1 1 2
# Character vectors
as_abundances(c("A", "C", "B", "C"))
#> # A tibble: 1 × 5
#> site weight A B C
#> <chr> <dbl> <dbl> <dbl> <dbl>
#> 1 site_1 4 1 1 2