This method is from the dbmss package. See dbmss::autoplot.wmppp.
Usage
# S3 method for class 'wmppp'
autoplot(
  object,
  ...,
  show.window = TRUE,
  MaxPointTypes = 6,
  Other = "Other",
  main = NULL,
  xlab = NULL,
  ylab = NULL,
  LegendLabels = NULL,
  labelSize = "Weight",
  labelColor = "Type",
  palette = "Set1",
  windowColor = "black",
  windowFill = "transparent",
  alpha = 1
)
Arguments
- object
an object to be plotted.
- ...
extra arguments, currently unused.
- show.window
if
TRUE, the borders of the window containing the points are shown on the point map.- MaxPointTypes
the maximum number of different point types to show. If the point set contains more of them, the less frequent ones are gathered as "Other". This number must be limited for readability and not to exceed the number of colors offered by the palette.
- Other
the name of the point types gathered as "Other"
- main
the title of the plot.
- xlab
the X-axis label.
- ylab
the Y-axis label.
- LegendLabels
a vector of characters. The first two items describe the observed and null-hypothesis curves, the third and last item the confidence interval. To be used only in plots with two curves (typically observed and expected values). The default is
NULLto display the full description of functions.- labelSize
the guide of the point size legend in point maps, i.e. what the
PointSizemark represents.- labelColor
the guide of the point color legend in point maps, i.e. what the
PointTypemark represents.- palette
the color palette used to display point types in maps. See ggplot2::scale_colour_brewer.
- windowColor
the color used to draw the limits of the windows in point maps.
- windowFill
the color used to fill the windows in point maps.
- alpha
the opacity of the confidence envelope (in function values) or the points (in maps), between 0 and 1.
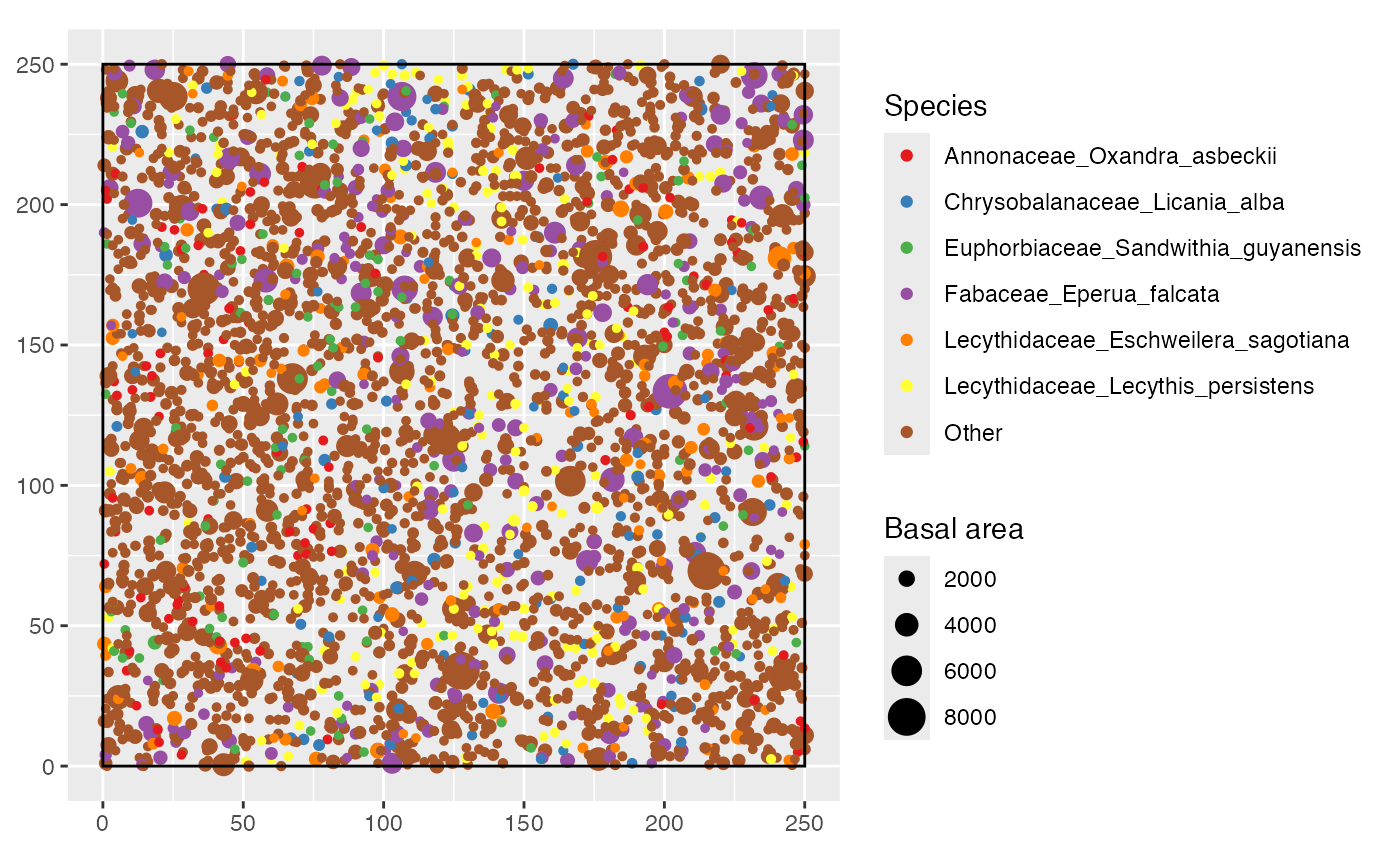
Examples
if (require("ggplot2")) {
  autoplot(paracou_6_wmppp) +
    # use radius scale because point sizes are already areas
    scale_radius() +
    labs(color = "Species", size = "Basal area")
}
#> Loading required package: ggplot2