Plot objects of class "accumulation" produced by accum_hill and other accumulation functions.
Usage
# S3 method for class 'accumulation'
autoplot(
  object,
  ...,
  main = NULL,
  xlab = "Sample Size",
  ylab = NULL,
  shade_color = "grey75",
  alpha = 0.3,
  lty = 1,
  lwd = 0.5
)
Arguments
- object
An object of class "accumulation".
- ...
Unused.
- main
The main title of the plot.
- xlab
The label of the x-axis.
- ylab
The label of the y-axis.
- shade_color
The color of the shaded confidence envelopes.
- alpha
The opacity of the confidence envelopes, between 0 (transparent) and 1 (opaque).
- lty
The line type of the curves.
- lwd
The line width of the curves.
Value
A ggplot2::ggplot object.
Examples
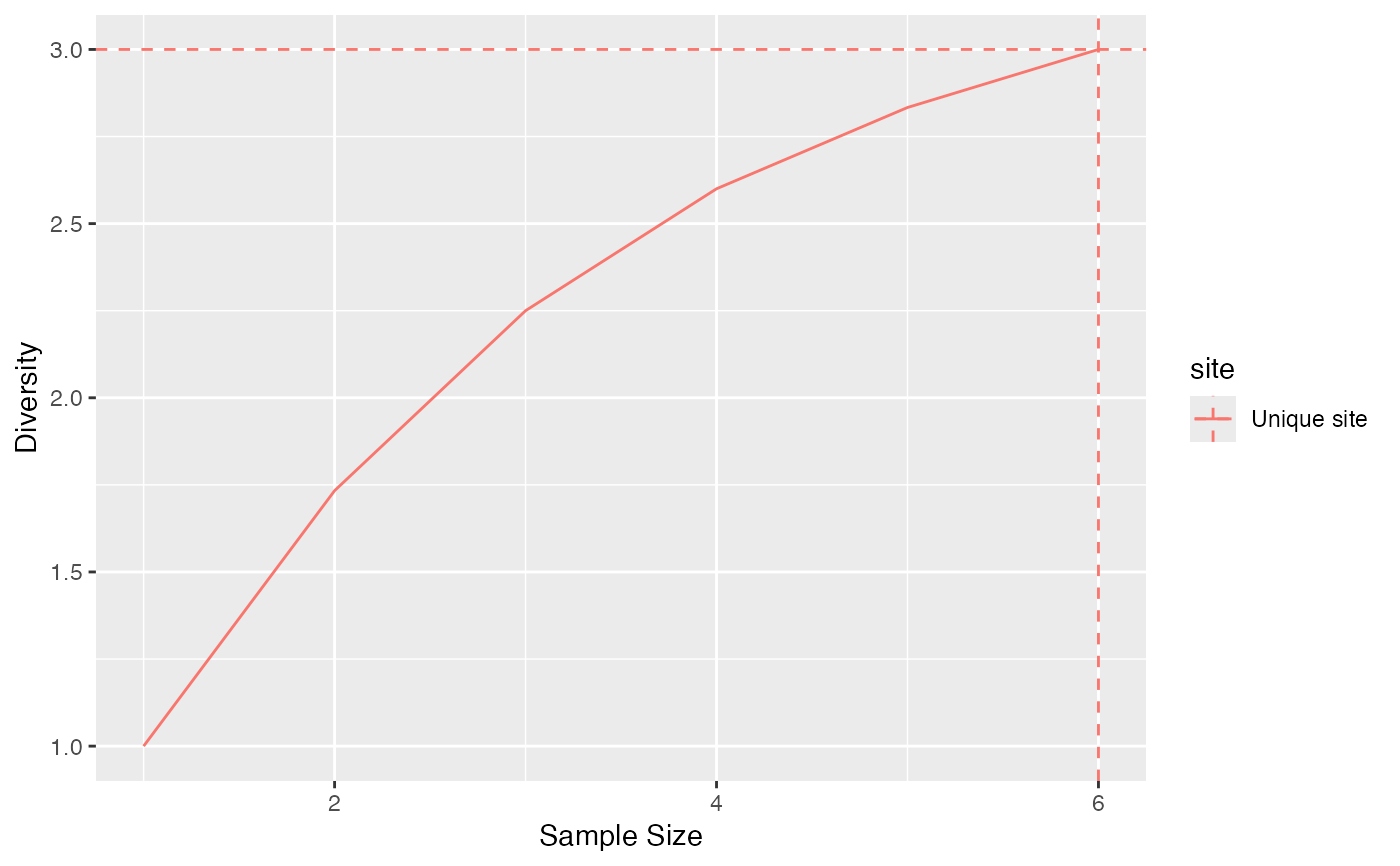
# Species accumulation curve
autoplot(accum_hill(mock_3sp_abd))