Random Communities
rCommunity.RdDraws random communities according to a probability distribution.
Usage
rCommunity(n, size = sum(NorP), NorP = 1, BootstrapMethod = "Chao2015", S = 300,
    Distribution = "lnorm",  sd = 1, prob = 0.1, alpha = 40,
    CheckArguments = TRUE)
Arguments
- n
The number of communities to draw.
- size
The number of individuals to draw in each community.
- BootstrapMethod
The method used to obtain the probabilities to generate bootstrapped communities from observed abundances. If
"Marcon", the probabilities are simply the abundances divided by the total number of individuals (Marcon et al., 2012). If"Chao2013"or"Chao2015"(by default), a more sophisticated approach is used (seeas.ProbaVector) following Chao et al. (2013) or Chao et al. (2015).- NorP
A numeric vector. Contains either abundances or probabilities.
- S
The number of species.
- Distribution
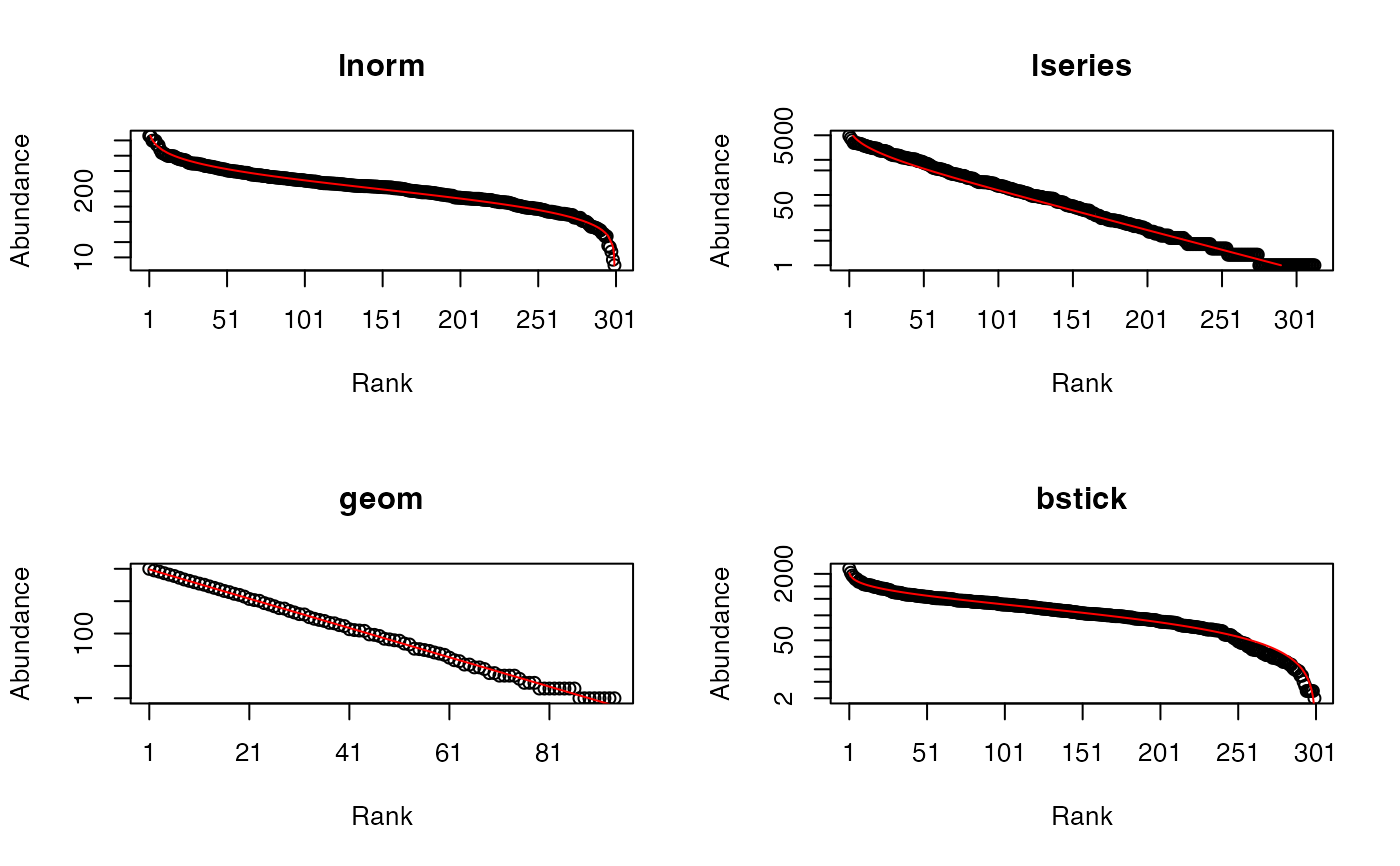
The distribution of species frequencies. May be
"lnorm"(log-normal),"lseries"(log-series),"geom"(geometric) or"bstick"(broken stick).- sd
The simulated distribution standard deviation. For the log-normal distribution, this is the standard deviation on the log scale.
- prob
The proportion of ressources taken by successive species.
- alpha
Fisher's alpha.
- CheckArguments
Logical; if
TRUE, the function arguments are verified. Should be set toFALSEto save time when the arguments have been checked elsewhere.
Details
Communities of fixed size are drawn in a multinomial distribution according to the distribution of probabilities provided by NorP.
An abundance vector may be used instead of probabilities, then size is by default the total number of individuals in the vector. Random communities are built by drawing in a multinomial law following Marcon et al. (2012), or trying to estimate the distribution of the actual community with as.ProbaVector. If BootstrapMethod = "Chao2013", the distribution is estimated by a single parameter model and unobserved species are given equal probabilities. If BootstrapMethod = "Chao2015", a two-parameter model is used and unobserved species follow a geometric distribution.
Alternatively, the probabilities may be drawn following a classical distribution: either a lognormal ("lnorm") one (Preston, 1948) with given standard deviation (sd; note that the mean is actually a normalizing constant. Its values is set equal to 0 for the simulation of the normal distribution of unnormalized log-abundances), a log-series ("lseries") one (Fisher et al., 1943) with parameter alpha, a geometric ("geom") one (Motomura, 1932) with parameter prob, or a broken stick ("bstick") one (MacArthur, 1957). The number of simulated species is fixed by S, except for "lseries" where it is obtained from alpha and size: \(S=\alpha \ln(1 + \frac{size}{\alpha})\).
Log-normal, log-series and broken-stick distributions are stochastic. The geometric distribution is completely determined by its parameters.
Value
A vector of species abundances (AbdVector) if a single community has been drawn, or a MetaCommunity containing simulated communities.
References
Chao, A., Wang, Y. T. and Jost, L. (2013). Entropy and the species accumulation curve: a novel entropy estimator via discovery rates of new species. Methods in Ecology and Evolution 4(11): 1091-1100.
Chao, A., Hsieh, T. C., Chazdon, R. L., Colwell, R. K., Gotelli, N. J. (2015) Unveiling the Species-Rank Abundance Distribution by Generalizing Good-Turing Sample Coverage Theory. Ecology 96(5): 1189-1201.
Fisher R.A., Corbet A.S., Williams C.B. (1943) The Relation Between the Number of Species and the Number of Individuals in a Random Sample of an Animal Population. Journal of Animal Ecology 12: 42-58.
MacArthur R.H. (1957) On the Relative Abundance of Bird Species. PNAS 43(3): 293-295.
Marcon, E., Herault, B., Baraloto, C. and Lang, G. (2012). The Decomposition of Shannon's Entropy and a Confidence Interval for Beta Diversity. Oikos 121(4): 516-522.
Motomura I. (1932) On the statistical treatment of communities. Zoological Magazine 44: 379-383.
Preston, F.W. (1948). The commonness, and rarity, of species. Ecology 29(3): 254-283.
Reese G. C., Wilson K. R., Flather C. H. (2013) Program SimAssem: Software for simulating species assemblages and estimating species richness. Methods in Ecology and Evolution 4: 891-896.
See also
SpeciesDistribution and the program SimAssem (Reese et al., 2013; not an R package) for more distributions.
