The entropart package provides generic methods to measure diversity. S3 methods to aplly them to simulated communities are available here. AbdVector returns an abundance vector and ProbaVector returns a probability vector. Tsallis returns Tsallis's entropy of a community, Diversity its diversity. Richness, Shannon and Simpson return particular indices of diversity.
# S3 method for pattern_matrix_individuals
as.AbdVector(x, ...)

# S3 method for pattern_matrix_individuals
as.ProbaVector(x, ...)

# S3 method for pattern_matrix_individuals
Tsallis(NorP, q = 1, Correction = "Best", ..., CheckArguments = TRUE)

# S3 method for pattern_matrix_individuals
Diversity(NorP, q = 1, Correction = "Best", ..., CheckArguments = TRUE)

# S3 method for pattern_matrix_individuals
Richness(
  NorP,
  Correction = "Chao1",
  Alpha = 0.05,
  JackOver = FALSE,
  ...,
  CheckArguments = TRUE
)

# S3 method for pattern_matrix_individuals
Shannon(NorP, Correction = "Best", ..., CheckArguments = TRUE)

# S3 method for pattern_matrix_individuals
Simpson(NorP, Correction = "Lande", ..., CheckArguments = TRUE)
Arguments
- x
An object of class pattern_matrix_individuals.
- ...
Further arguments. Unsused.
- NorP
An object of class "wmppp" (pattern_matrix_individuals).
- q
A number: the order of entropy. Some corrections allow only a positive number. Default is 1 for Shannon entropy.
- Correction
A string containing one of the possible corrections: "None" (no correction), and "Best" are always valid. See the generic function help for other possibilities.
- CheckArguments
If
TRUE(default), the function arguments are verified. Should be set toFALSEto save time in simulations for example, when the arguments have been checked elsewhere.- Alpha
The risk level, 5% by default, used to optimize the jackknife order.
- JackOver
If
TRUE, retain the jackknife order immediately superior to the optimal one, usually resulting in the overestimation of the number of species. Default isFALSE.
Examples
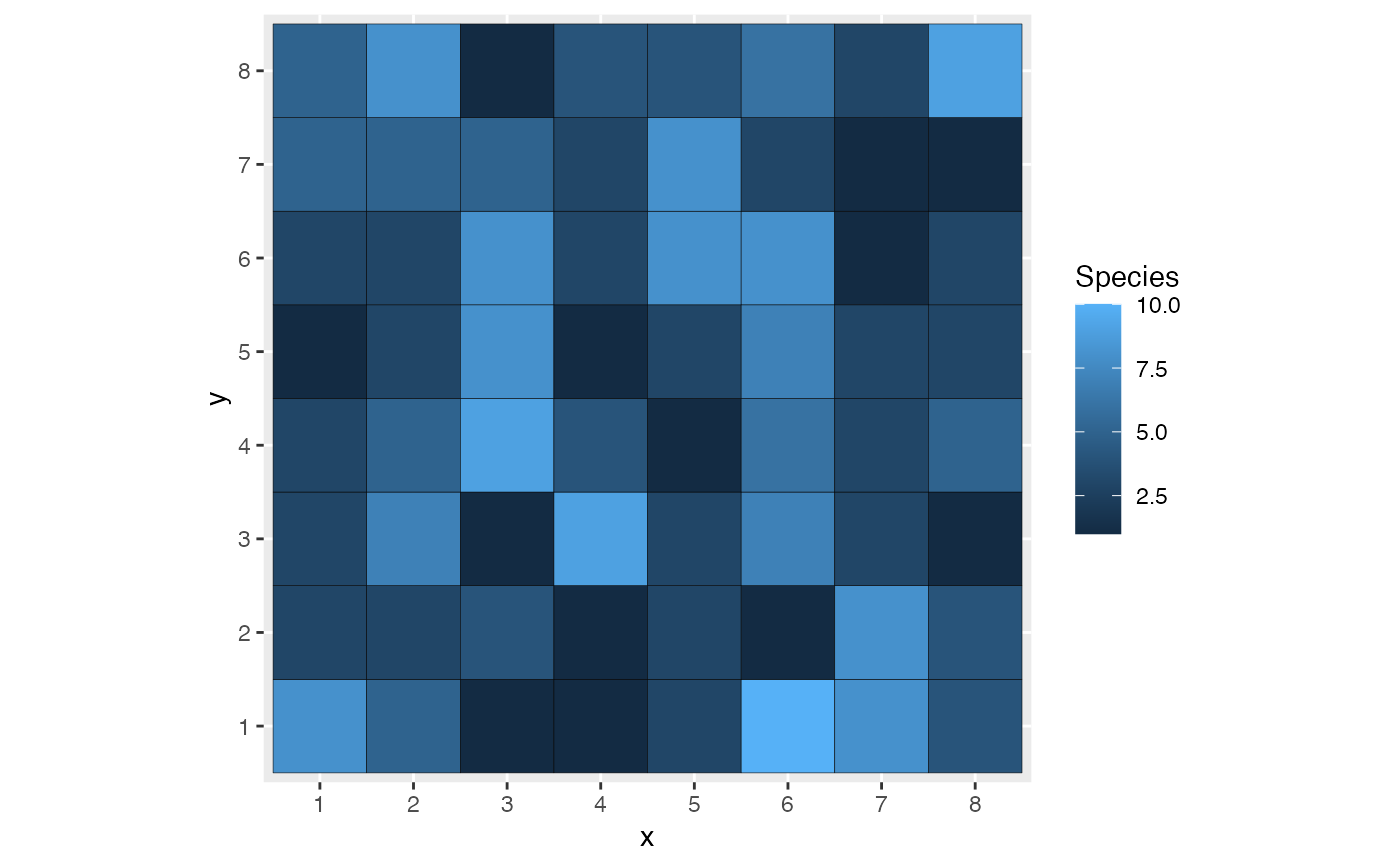
# A community matrix drift model
myModel <- cm_drift$new(pattern_matrix_individuals(S=10))
myModel$autoplot()

as.AbdVector(myModel$pattern)
#>  1  3  4  5  6  7  8  9 10
#> 13 20  6  7  2  3  9  3  1
#> attr(,"class")
#> [1] "AbdVector"           "SpeciesDistribution" "array"
as.ProbaVector(myModel$pattern)
#>        1        3        4        5        6        7        8        9
#> 0.203125 0.312500 0.093750 0.109375 0.031250 0.046875 0.140625 0.046875
#>       10
#> 0.015625
#> attr(,"class")
#> [1] "ProbaVector"         "SpeciesDistribution" "array"
Tsallis(myModel$pattern)
#>  UnveilJ
#> 1.937234
Diversity(myModel$pattern)
#>  UnveilJ
#> 6.939533
Richness(myModel$pattern)
#>    Chao1
#> 9.492188
Shannon(myModel$pattern)
#>  UnveilJ
#> 1.937234
Simpson(myModel$pattern)
#>    Lande
#> 0.827877
as.AbdVector(myModel$pattern)
#> 1 3 4 5 6 7 8 9 10
#> 13 20 6 7 2 3 9 3 1
#> attr(,"class")
#> [1] "AbdVector" "SpeciesDistribution" "array"
as.ProbaVector(myModel$pattern)
#> 1 3 4 5 6 7 8 9
#> 0.203125 0.312500 0.093750 0.109375 0.031250 0.046875 0.140625 0.046875
#> 10
#> 0.015625
#> attr(,"class")
#> [1] "ProbaVector" "SpeciesDistribution" "array"
Tsallis(myModel$pattern)
#> UnveilJ
#> 1.937234
Diversity(myModel$pattern)
#> UnveilJ
#> 6.939533
Richness(myModel$pattern)
#> Chao1
#> 9.492188
Shannon(myModel$pattern)
#> UnveilJ
#> 1.937234
Simpson(myModel$pattern)
#> Lande
#> 0.827877